Exposing the Hidden Factory: How COPQ Reveals Capacity Constraints
The Constraint You Are Not Measuring
If your production schedule is consistently slipping despite stable staffing, available equipment, and adequate material supply, the primary constraint may not be visible in your capacity model.
In many GMP manufacturing environments, the limiting factor is not physical capacity—it is the volume of unplanned work consuming planned capacity.
Deviation investigations, batch failures, rework, and repeated review cycles quietly absorb time and resources that were assumed to be available for production. These activities are rarely modeled explicitly, yet they directly impact throughput, cycle time, and delivery reliability.
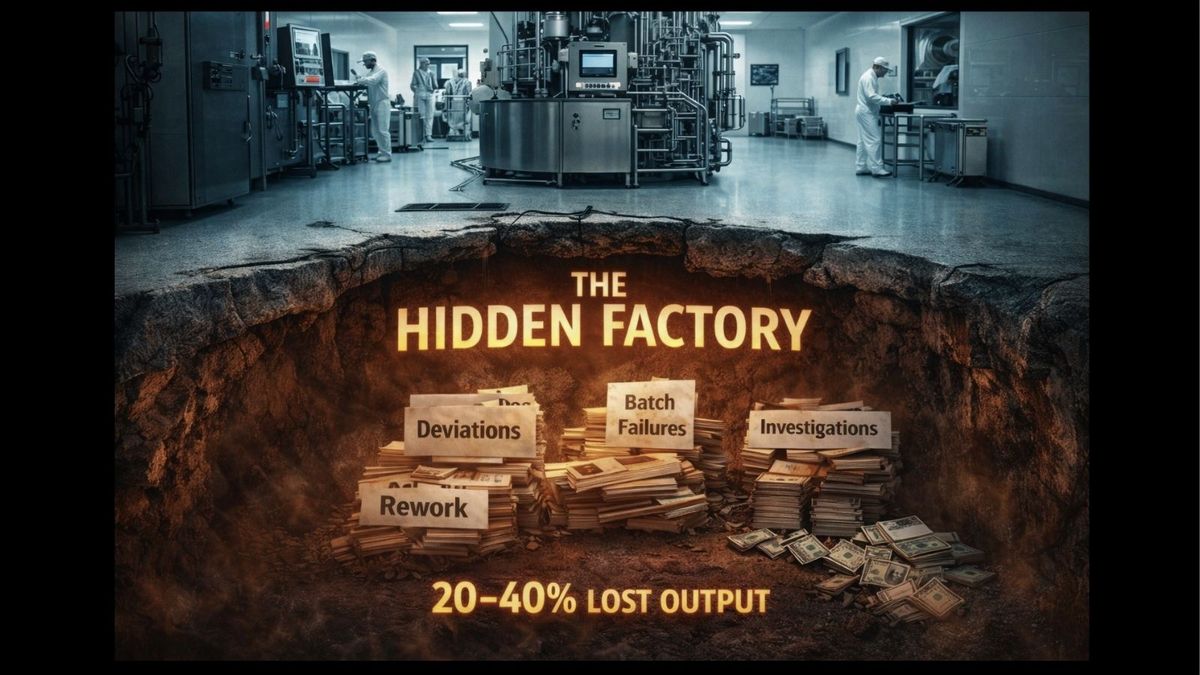
This is the Hidden Factory.
The Hidden Factory as the True Constraint
The Hidden Factory represents the portion of operations consumed by non-value-added work.
Common examples include:
- Deviation investigations and review cycles
- Batch failures and re-planning
- Rework and scrap handling
- Documentation corrections and repeated QA review
In poorly controlled systems, this work can consume a substantial share of operational effort. Quality literature often suggest that more mature organizations operate with approximately 10–15% cost of poor quality, while poorly controlled systems may experience significantly higher levels—sometimes cited in the 20–40% range in extreme cases. The exact magnitude varies by site and maturity level.
What is consistent is this:
Hidden factory activity consumes planned capacity but is rarely included in capacity models.
As a result, organizations frequently misidentify their constraint—investing in additional equipment, staffing, or scheduling optimization while the true limiting factor remains unaddressed.
Converting Hidden Work into Economic Terms
If capacity is being consumed by hidden factory activity, the next question is:
What is that consumption worth?
The Cost of Quality (COQ) framework provides a structured method to answer this.
COQ classifies quality-related costs into three categories:
- Prevention (systems, training, infrastructure)
- Appraisal (inspection, testing, review)
- Failure
- Internal failure (before release)
- External failure (after release)
Prevention and appraisal represent the cost of achieving good quality. Failure represents the Cost of Poor Quality (COPQ).
Quantifying COPQ translates hidden factory activity into measurable economic impact:
- Labor hours consumed by investigations and rework
- Manufacturing capacity lost to failed or delayed batches
- Release delays impacting supply and revenue
This translation shifts the discussion from operational frustration to economic decision-making.
Decision Framing: Recover Capacity vs Add Capacity
Once quantified, hidden factory activity becomes a strategic lever.
Organizations typically face a choice:
- Invest to add capacity (capital expansion, hiring, scheduling optimization)
- Recover existing capacity by reducing internal failure and rework
In many cases, sites experiencing even moderate internal failure rates (e.g., high deviation volume, rework, or batch rejection) can recover meaningful capacity faster through quality system improvements than through capital investment.
This is particularly relevant in GMP environments where:
- Cycle time is extended by investigation and review processes
- QA release becomes a pacing function
- Rework introduces variability and planning instability
Regulatory and Inspection Context
Elevated hidden factory activity is not only an operational issue—it has regulatory implications.
- ICH Q10 emphasizes process performance and continual improvement
- ICH Q9 supports risk-based prioritization of quality issues
From an inspection perspective, persistent deviation volume, rework, and documentation errors may be interpreted as indicators of inadequate process control rather than isolated events.
This reinforces the importance of reducing internal failure—not only for efficiency, but for maintaining a defensible state of control.
From Capacity Expansion to Capacity Recovery
The Hidden Factory represents real consumption of time, labor, and capacity—even when it is not explicitly measured.
The Cost of Quality framework provides the mechanism to quantify that consumption.
When these concepts are connected, organizations gain visibility into a category of loss that is often embedded within normal operations.
That visibility enables a different type of decision:
Not how to add capacity—but how to recover it.
The first step is measurement.
A Practical Starting Point
Many organizations underestimate internal COPQ because a significant portion of capacity consumption is not formally measured.
Even a directional estimate is often sufficient to reveal order-of-magnitude opportunity.
GMPKit provides a Cost of Poor Quality calculator designed for pharmaceutical manufacturing environments.
The calculator translates common quality system activities—such as deviations, batch failures, rework, and documentation errors—into estimated internal COPQ impact. The inputs and formulas used to calculate COPQ are visible and transparent on the page, simplifying the quantification process.
This enables leadership teams to:
- Visualize hidden capacity consumption
- Prioritize improvement efforts
- Evaluate tradeoffs between operational improvement and capital investment
To get started, you can access the free calculator here:
