Deviation Backlogs Are Not Linear: Understanding the Hidden Factory in GMP Investigations
Deviation costs are typically understood as linear once the severity is classified. A minor, major, or critical deviation requires one investigation, consuming a generally predictable amount of time, labor, and cost. At low volume, this assumption holds. Each deviation investigation record moves through the system with bounded effort, and total cost scales proportionally with workload.
This is a linear system:
- Input increases → effort increases at a constant rate
- Cost per unit remains stable
However, once investigation demand exceeds system capacity, the behavior changes.
“The greatest shortcoming of the human race is our inability to understand the exponential function.” — Albert A. Bartlett
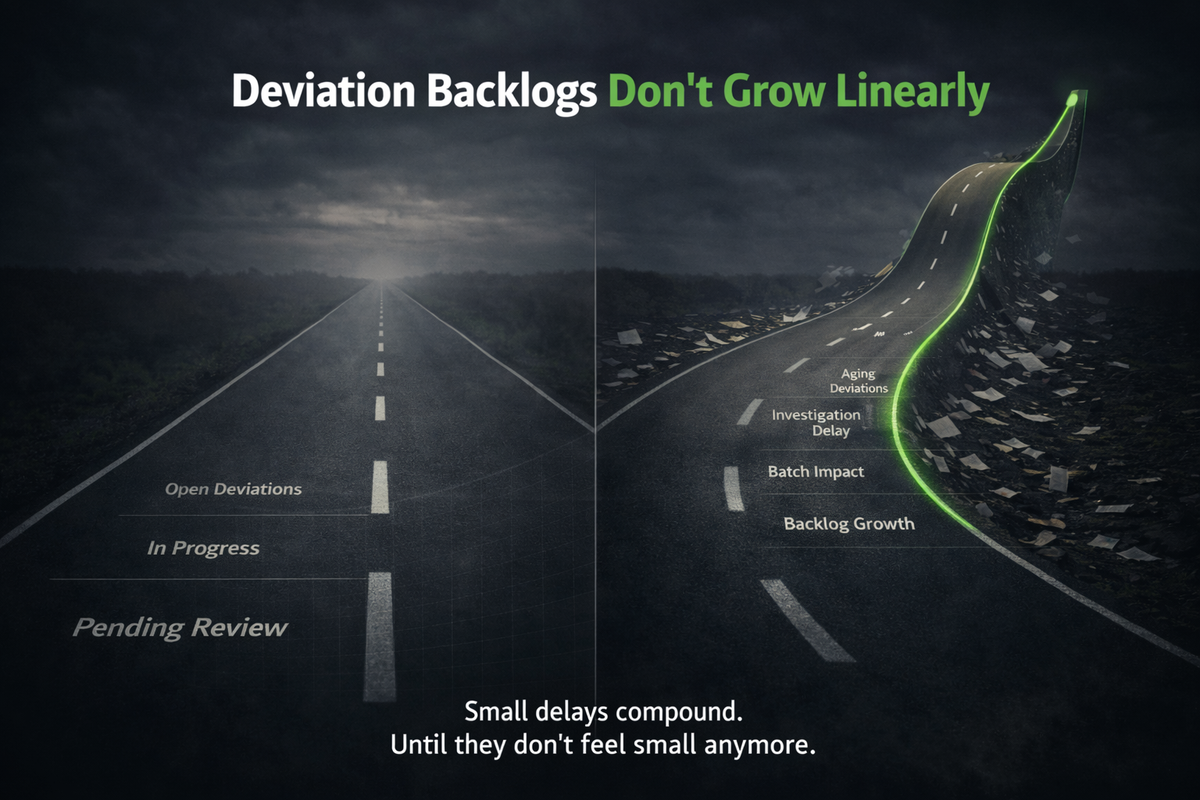
Backlogs introduce exponential characteristics:
- Each additional open deviation does not just add work—it increases the coordination, tracking, and recovery effort across all open records
- Aging records require extensions, escalations, and rework
- Stakeholder communication and prioritization overhead expand nonlinearly
This is no longer a processing problem; it is a queue management problem with compounding cost.
The result is the formation of a Hidden Factory—capacity consumed not by resolving deviations, but by managing the consequences of too many unresolved deviations. Cost is no longer proportional to the number of records; it accelerates as backlog grows.
To understand this shift, we can move from abstract mathematics to a physical system we are all familiar with - flight delays.
Air Traffic Control Metaphor — Deviation Backlog
A deviation backlog behaves like an over-capacity runway system—where aircraft are no longer landing in sequence, but entering holding patterns, consuming fuel while waiting for clearance.
This model makes the exponential nature of backlog visible.
In a system operating within capacity, deviation investigations behave like aircraft moving through a well-managed airport. Each plane is assigned a runway slot, sequenced predictably, and lands without delay. Air traffic control maintains visibility, spacing, and flow. Fuel consumption is proportional to the flight itself—no excess coordination, no wasted motion. The system is in control.
When demand exceeds runway capacity, the system changes character.
Aircraft are no longer landing—they are circling. Each enters a holding pattern, waiting for clearance. What was once a linear flow becomes a managed queue. And that queue is not neutral.
Planes in holding patterns burn fuel. Crews consume duty time. Air traffic control increases communication frequency, re-sequences arrivals, and continuously reassesses priorities as conditions change. Small disruptions propagate. Variability increases.
In this state, the system is no longer primarily executing landings—it is managing congestion.
A deviation backlog behaves the same way.
Each open investigation is an aircraft in the air. As backlog grows beyond processing capacity:
- Records require extension reports (fuel burn)
- Stakeholder updates increase (ATC communication load)
- Prioritization cycles intensify (dynamic resequencing)
- Aging records become more complex to close (degraded conditions)
The key shift is economic and operational:
- In flow: effort scales with the number of investigations
- In backlog: effort scales with the backlog and the cost of managing the backlog
At high utilization, a disproportionate share of resources is consumed not by resolving deviations, but by coordinating, tracking, and sustaining them.
The objective, therefore, is not simply to “work harder” or “process more investigations.”
It is to restore controlled flow—to bring arrival rate back within runway capacity—so that effort returns to value-added resolution rather than queue management.
Your Roadmap to Eliminate Deviation Backlogs and Restore Flow
In an investigation backlog reduction project, the objective is to restore controlled flow by reducing backlog below system capacity and preventing recurrence. A common approach is to build a temporary backlog team, swarm the problem, then disband and everybody goes back to their normal responsibilities.
While this approach will temporarily improve the numbers, it rarely persists and sometimes has the unintended consequences of growing the backlog. As the backlog team focuses on the work in process, other responsibilities are deprioritized, creating new failure modes.
The deviation backlog reduction team is a bulldozer approach that rarely works. We prefer to use a much more strategic domino approach - identifying the first domino and letting momentum take over.
Follow this link to review a case study where GMPKit eliminated a deviation backlog using our approach and investigation framework.
Our standard approach is outlined and shared below:
Step 1 — Operational Diagnostics
Your goal in step 1 is to establish objective truth. This is the scoping phase of the project and arguably the most important step because the information generated here will capture the “current state” and be used in each of the subsequent steps:
Focus
- Quantify backlog size (count, age distribution)
- Quantify current cycle times (initiation → closure)
- Segment by type, function, and aging risk
- Identify demand vs. capacity gap
Output
- Baseline: backlog magnitude, inflow rate, processing capacity
- Clear constraint identification
- Initial estimate of “time-to-clear” under current vs. improved conditions
Decision Gate
- Clarity on where to intervene first for fastest backlog reduction (highest ROI)
Step 2 — Readiness & Remediation Design
Once you have completed step 1, the problem is clearly defined. Step 2 is all about seeking the solutions that will define the transformation. Cross functional alignment and vision is developed in step 2.
Focus
- Define target state (flow conditions, WIP limits, cycle time targets)
- Identify bottlenecks (QA review, SME bandwidth, investigation quality)
- Build remediation plan (capacity, process changes, triage rules)
- Secure cross-functional commitment
Output
- Prioritized remediation plan (sequenced actions, owners, timing)
- Defined readiness criteria (resources, standards, escalation paths)
- Agreed transformation vision including purpose, change objectives, outcome and outputs.
Decision Gate - Control Confidence
- Safety
By definition, a deviation investigation represents departure from the expected state. This phase ensures system controls are in place to protect patients (disposition gates) and internal employees (operational safety) while the backlog is addressed. - Compliance
All documentation of the plan is in place, any departures from the normal procedure are captured with clear rationale. - Schedule
At the site leadership level, there is cross functional alignment on how the plan will execute without creating secondary instability
Step 3 — Governance & Execution
Once phase 2 is in place, phase 3 establishes the governance structure to monitor the plan. We have found that the application of a full PDCA “loop” is the most effective way to drive the transformation.

Regardless of the meeting cadence or if the governance is embedded in existing or new structure, the system must have these four components:
Planning Component
- Explicit prioritization logic (risk, age, impact)
- Controlled WIP and sequencing
- Clarity on who, what, and when
Do (The Execution Phase)
- Dedicated resources aligned to plan
- Cross-functional execution cadence
Check
- Process confirmation - review of the measures of success:
- Backlog burn down - target vs. actual
- Cycle time vs. target
- Aging risk
Adjust
The adjust phase is the strategic directional check. The adjust phase is essentially the steering committee, ensuring the plan is acceptable and triggering actions back to the planning phase if the effort is off track.
- Rapid correction of constraints and failure modes
- Reallocate resources dynamically
Step 3 Governance and Execution Output
Step three is the ROI step, it continues until the backlog is gone and the system is restored. Outputs of the step include
- Measurable backlog reduction
- Stabilized flow (inflow ≤ outflow)
Step 4 — Sustainment (Prevent Recurrence)
Step 4 of the process involves monitoring - bringing the restored system to a dashboard state with the proper measures.
Focus
- Maintain WIP limits and cycle time control
- Embed standard work and escalation triggers
- Monitor leading indicators (inflow spikes, aging thresholds)
Output
- Stable system operating within capacity
- No backlog re-accumulation
Systems Thinking in Deviation Backlogs
Deviation backlogs are not a capacity problem alone—they are a system behavior problem.
Once flow is lost, effort shifts from resolving deviations to managing them. Costs accelerate, visibility degrades, and control erodes.
Restoring performance requires more than clearing the backlog. It requires re-establishing a system that can sustain flow under normal operating conditions.
The organizations that succeed are not those that work harder—they are those that redesign the system so that backlog conditions cannot persist.
Tags
Related Posts

Exposing the Hidden Factory: How COPQ Reveals Capacity Constraints
The Hidden Factory represents unmeasured capacity consumed by internal failure activities such as deviation investigations, production rework, and documentation errors. While these activities are tracked operationally, their economic impact is rarely quantified. Applying the Cost of Quality framework translates this consumption into financial terms, providing a basis for capacity recovery and risk-informed prioritization aligned with ICH Q9 and Q10.

Don’t Start Conversations as a Bulldozer — Start Them as a Domino
Most operational conversations in pharmaceutical manufacturing begin like bulldozers—forceful, reactive, and loud. Effective leaders start them like dominos: small, precise actions that trigger system-wide improvement.

Dashboards Don’t Stop Debris
Dashboards were never meant to be decorative. The original dashboard existed to stop debris before it reached the passenger. Modern business dashboards do the opposite — they measure the mess after it hits. In pharmaceutical manufacturing, that mess shows up as lost batches, deviation backlog, delayed disposition, and rework — the true drivers of Cost of Poor Quality. Visibility alone does not prevent failure. Structural correction does.