Quality System Governance Archetypes: The Faucet, the Sink, and the Drain
A simple stock-to-flow model for making Quality Systems KPI generation and GMP quality governance faster, clearer, and more actionable.
Have you ever joined a meeting where the KPI review seemed much harder than it needs to be?
Every system has its own dashboard. Every dashboard has its own set of metrics. Each of those metrics has its own explanation. By the end of the meeting, everyone has looked at dozens of slides and colorful charts, but nobody really understands the current state or what will happen next.
Pharmaceutical Quality Assurance is composed of inter-related systems, so in Quality Systems KPI review meetings this can be especially true.
The problem is not the people that created the slide or dashboards. The issue is not a lack of data. The issue is that most governance meetings do not organize the data into a pattern leaders can act on.
If you are not familiar with stock to flow, or the faucet-sink-drain metaphor of systems thinking, today is your lucky day. Once you see this pattern, system KPI review becomes simplified and the meeting effectiveness can be quickly multiplied.
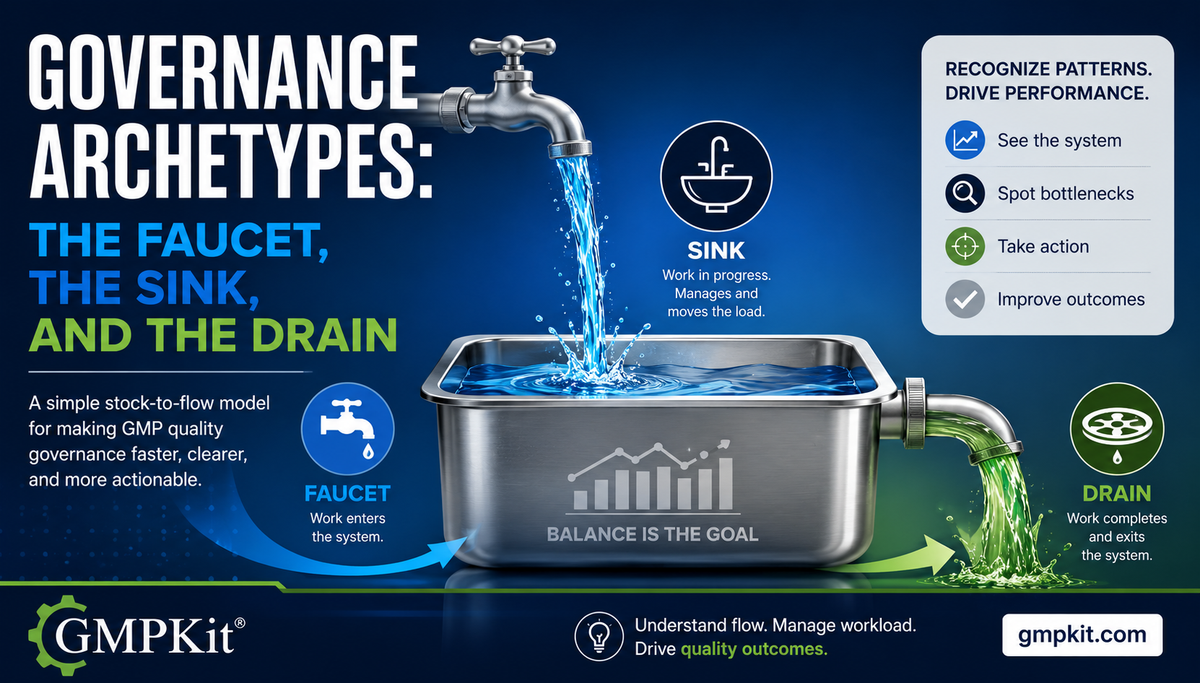
Stock to Flow: The Faucet, the Sink, and the Drain
Here is the easiest way to understand the stock to flow system.
Imagine a sink.
There is a faucet bringing water in. There is a drain allowing water out. The sink itself is the reservoir and if everything is in balance, the water stays in the sink.
That is the basic structure of several GMP quality systems. Three parts, separate functions.
These systems behave like reservoirs—work enters, waits, moves, ages, and eventually exits. The names changes by system, but the behavior is often the same.

Different names. Different departments. Same operational behavior.
This stock to flow pattern is the foundational idea behind what we like to call Governance Archetypes.
Governance archetypes are recurring operational patterns that appear across multiple quality systems. Once leadership teams recognize these patterns, KPI review becomes less about explaining numbers and more about identifying system behavior.
Recognizing governance archetypes allows for the rapid identification of systemic issues during KPI reviews, as these patterns frequently recur across various operations.
Why Governance Meetings Become Noisy
Before introducing our archetypal cast of characters, let’s take a moment to focus on the core problem we are about to solve.
Most governance meetings focus on isolated metrics instead of system behavior.
- One slide says deviations increased.
- Another says CAPA aging improved.
- Another says change controls are overdue.
- Another says the maintenance backlog is stable.
But what does all of this information mean? Are we winning or losing? Is the system going to handle the throughput or will it fail? Are we in a state of control? In ineffective governance meetings stakeholders spend most of the meeting translating numbers instead of understanding flow.
But once you identify your systems that demonstrate stock to flow behaviour and standardize the view, patterns start appearing immediately.
Here are a few of our favorites.
Governance Archetype Pattern #1: The Faucet Surge
This is one of the most common patterns in GMP Quality systems.
The faucet opens faster than the drain can handle.
At first, everything still looks stable:
- investigators are still closing records
- aging is still acceptable
- dashboards still appear green
But the sink is slowly filling, increasing hidden operational load, investigation labor consumption, and future compliance risk.
You usually see this during:
- scale-up
- startup activity
- unstable manufacturing periods
- equipment reliability decline
- staffing transitions
- post-inspection remediation
The dangerous part is that traditional metrics often lag behind reality.
By the time aging metrics become critical, the operational stress has already existed for months.
The earliest signal is often not backlog. Records are ageing, building a compliance risk and creating a hidden factory.
A stock to flow aligned KPI dashboard reveals this pattern immediately. It is an inflow surge.
Too many new records entering the system, causing a disruption to the balance.
Governance Archetype Pattern #2: The Blocked Drain
Sometimes inflow remains stable, but the backlog still grows.
This means the drain is restricted.
Something is slowing throughput.
Common causes:
- QA approval rework loops
- excessive review cycles
- unclear ownership
- poor investigation quality
- cross-functional delays
- ineffective escalation
This is where many organizations make the wrong move.
Leadership starts pushing people harder:
- more meetings
- more pressure
- more status updates
- specialized groups and tiger teams
These are the elements of the hidden factory. But pressure does not fix bottlenecks.
Systems only improve when constraints are removed.
Governance Archetype Pattern #3: The Predictive Flood
Many governance systems review:
- current backlog
- aging buckets
- overdue counts
But those are all lagging indicators. The problem already exists.
The more predictive signal is the velocity of accumulation across time.
Or more simply: Is the sink filling faster each period?
Or mathematically: input / output ratio
This is where the model becomes genuinely useful. At some point the system always breaks (the flood). Prior to the breaking point a stock to flow aligned KPI system will demonstrate accumulation of volume in the reservoir.
Backlog formation is primarily indicated by accumulation, a state where the volume of incoming records consistently exceeds the capacity to close them.
Conversely, when the drain outpaces the faucet by processing more records than are opened, this metric signals active restoration and the successful remediation of the backlog.
Governance Archetype Pattern #4: Artificial Stability
This pattern is more dangerous because it looks healthy.
Deviation counts suddenly improve. Backlogs shrink. Metrics become cleaner.
Everyone celebrates.
The key insight here is to use the model to ask questions around the nature of the change in system behavior. Why did the faucet turn off?
Is there a linked, healthy signal that explains this or is there an unhealthy explanation:
- people stopped escalating small events
- initiation thresholds quietly increased
- teams began avoiding opening records
When multiple stock to flow systems are KPI aligned, it allows easy diagnosis across systems to ask system linked questions. In this example, perhaps a CAPA system is exhibiting signs of increased flow where reduced deviation inputs would be expected.
In the simplified model, these questions are easy to identify and answer.
Why This Matters Financially
Backlog is not just an administrative problem—it is a cost signal.
As work accumulates inside a quality system, the organization begins paying for it through investigation labor, review cycles, rework, escalation meetings, delayed disposition, and lost capacity.
That is one of the hidden mechanisms behind Cost of Poor Quality.
Most organizations do not feel the cost immediately because the burden spreads across departments. But the system is still consuming capacity. This governance model helps leadership identify accumulating execution friction before it disrupts throughput, quality, or operational stability.
Why Systems Thinking Matters
Modern organizations are overwhelmed by metrics. Data has never been more available, but separating signal from noise has never been harder. This is why mental models and simplification frameworks are so important.
Systems thinkers are not looking for more dashboards. They are looking for specific patterns that trigger high value actions.
They want to know:
- Is the system stable?
- Is workload increasing?
- Is throughput constrained?
- Is backlog accumulating?
- Are we approaching saturation?
- Can this system survive scale-up?
Those are systems-thinking questions.
And once your leadership team starts seeing quality systems through that lens, governance conversations become faster, clearer, and more actionable.
A Better Way to Structure Governance in 3 Simple Steps
So how can you apply this to your organization?
Step 1: Quality System KPI Standardization
Instead of every system using completely different logic, identify your stock to flow systems and standardize metrics around a few simple operational signals:

Step 2: Quality System Grouping
Group all of your stock to flow systems together in your KPI review agenda. Build on the pattern. Now stakeholders can compare multiple systems using the same mental model. The Signal becomes easier to spot. Noise starts disappearing.
Step 3: Quality KPI Training
Teach the patterns to your team. You can build a “stock to flow” training slide, or simply share this post with your stakeholders.
Once you see the pattern, you cannot unsee it. Then you enter the ROI phase. The shift from disparate KPI review to systems thinking is powerful because the common language increases collaborative problem solving in very short order.
The Bottom Line
Quality systems are operational flow systems that happen to exist inside a regulated environment.
Once you understand system flow, you stop treating governance meetings like administrative reporting exercises. You start treating them like operational control rooms.
And that is usually when organizations begin finding the hidden capacity trapped inside their own systems.
If this seems like alot, we can help. Sometimes bringing in a neutral party to cross organizational lines can accelerate these powerful changes. Click here to schedule a discovery call and unlock the hidden capacity trapped inside your system.
Tags
Related Posts

Dashboards Don’t Stop Debris
Dashboards were never meant to be decorative. The original dashboard existed to stop debris before it reached the passenger. Modern business dashboards do the opposite — they measure the mess after it hits. In pharmaceutical manufacturing, that mess shows up as lost batches, deviation backlog, delayed disposition, and rework — the true drivers of Cost of Poor Quality. Visibility alone does not prevent failure. Structural correction does.

Deviation Backlogs Are Not Linear: Understanding the Hidden Factory in GMP Investigations
Deviation investigations are often managed as a linear workload—one record, one investigation, one unit of effort. This assumption holds only while the system operates within capacity. Once backlog forms, the system behavior changes. Effort no longer scales with the number of deviations; it expands nonlinearly as coordination, prioritization, and aging effects take over. The result is a Hidden Factory—capacity consumed not by resolving deviations, but by managing them. Understanding this shift is critical: restoring performance is not about working harder, but about re-establishing flow in a system that has crossed into exponential cost.

Don’t Start Conversations as a Bulldozer — Start Them as a Domino
Most operational conversations in pharmaceutical manufacturing begin like bulldozers—forceful, reactive, and loud. Effective leaders start them like dominos: small, precise actions that trigger system-wide improvement.