You Ran the COPQ Calculator—Now Lead the Response.
You Completed Our COPQ Calculator. Now What?
In GMP Pharmaceutical Manufacturing, every operation has a Cost of Poor Quality (COPQ).
Whether it validates existing suspicions or reveals an unexpectedly large issue, this number is a signal. At its core, COPQ is the economic representation of system friction—lost capacity, delayed throughput, and inherent risk in your operation. In most cases, this is not theoretical loss—it is recoverable capacity already trapped in the system.
At GMPKit, we view COPQ as a prioritization tool for structured recovery and continuous improvement, aligned to ICH Q10 (Pharmaceutical Quality System) and ICH Q9 (Quality Risk Management).
We encourage you to discover yours. The calculator is free, provides quick results, and prioritizes transparency so you can see how the calculations are determined.
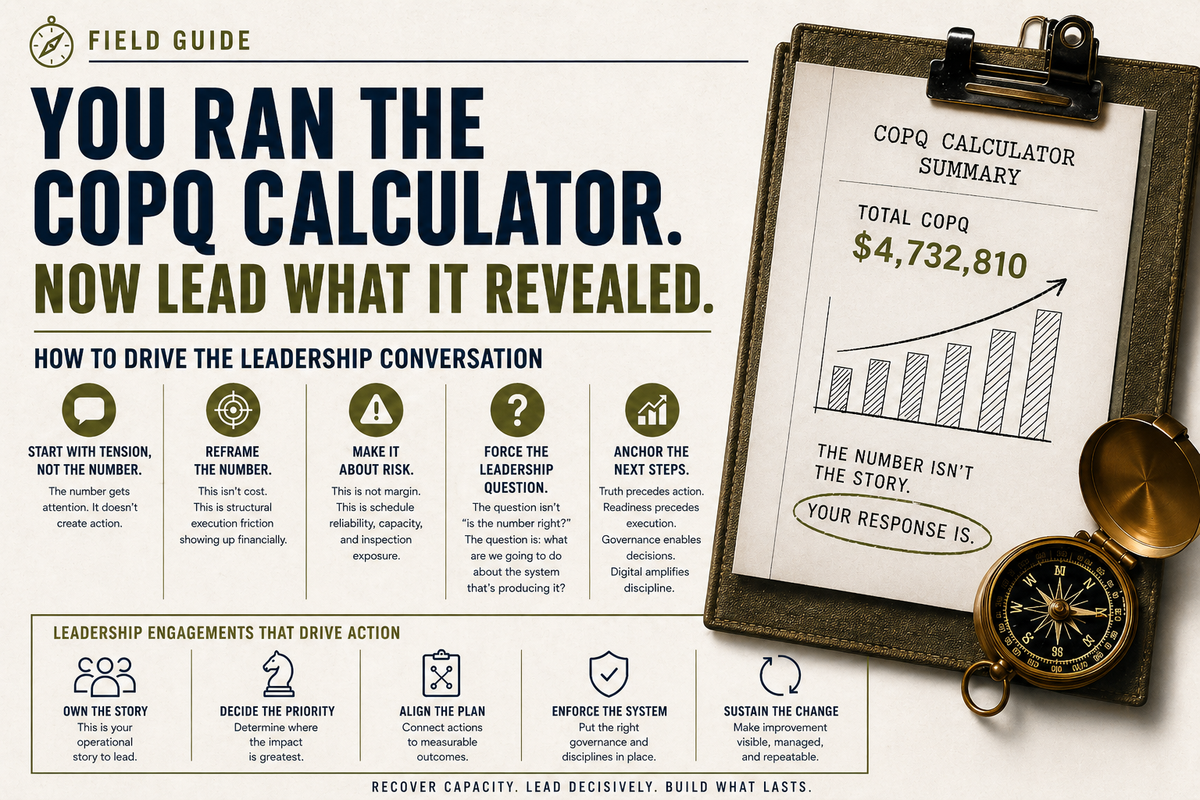
The number is not the value. What you do next is.
Here are four steps to convert COPQ into action:
Step 1: Diagnose the Biggest Contributor
Focus on the Pareto principle—identify the dominant cost contributor rather than overanalyzing the entire dataset.
In most pharmaceutical manufacturing environments, COPQ concentrates in a few predictable areas:
- Batch failure
- Deviation and investigation workload
- Rejects, scrap, and yield loss
- Batch release delays and backlog
The objective in this step is to convert a single COPQ number into a short list of meaningful drivers. This sets the stage to understand the causal chain.
Step 2: Establish the Causal Chain
Once the drivers are known, the next step is to understand why they exist.
Start simple. Move from cost to cause. The goal in this step is to identify the linkage between an action that can be taken to the overall cost:
Cost → Category → Hypothesis
As an example:
- High COPQ from deviations → Human Error → Lack of standardized execution and pre-job alignment
- Hypothesis: Introducing structured pre-job briefings and clear task ownership will reduce execution variability currently categorized as “human error.”
Avoid over engineering this step.
The goal is not perfect root cause—it is a clear, testable hypothesis.
Limit focus to one or two hypotheses that:
- Have material impact (cost and throughput)
- Can be tested quickly (30–60 days)
- Are likely to improve flow, not just reduce noise
Step 3: Implement (Through Governance)
Translate the hypothesis into action.
Do not launch a broad initiative. Execute a focused change.
- Assign one accountable owner
- Define one or two interventions
- Drive execution through enforced governance (daily/weekly cadence)
Without governance, hypotheses do not get tested—they get discussed.
Track only what matters:
- Cycle time
- Backlog
- Right-first-time
The objective is speed. You are looking for early signal that the hypothesis is directionally correct.
If nothing moves within a few weeks, the hypothesis is likely wrong or poorly implemented.
Step 4: Sustain
Once improvement is observed, lock it in.
Convert gains into measurable financial recovery and released capacity
Standardize what worked
Embed into governance routines
Recalculate COPQ to confirm effect
Position the outcome in economic terms:
Recovered capacity without additional headcount or capital investment.
Translate improvement into measurable financial recovery and released capacity.
Over time, this becomes a loop. COPQ identifies the next constraint. The system improves in cycles.
Common Failure Modes to Avoid
The key to recovery is structured problem solving executed through governance. Avoid the temptation to “sprint” or “pivot” without establishing the structure of habit and routine.
Here are a few symptoms:
- Jumping to solutions without defining a causal chain
- Spreading effort across too many priorities
- Measuring too many things or only lagging indicators
Start Focused
Select one value stream.
Identify one driver.
Test one hypothesis
Prove impact, then scale.
COPQ does not solve the problem. It shows you where execution is breaking.
Used correctly, it reveals a consistent pattern:
The constraint is rarely capacity. It is how the system is currently operating.
What Happens Next Is a Choice
Most organizations will run a COPQ calculation and stop there.
They’ll acknowledge the number.
They’ll discuss it briefly.
And then they’ll return to managing symptoms.
Not because they don’t care—but because they lack a structure to act on it.
COPQ only creates value when it is converted into focused execution and enforced through governance.
That is the difference between:
- Insight and impact
- Activity and recovery
- Visibility and control
In our experience, when COPQ is acted on correctly, the outcome is not marginal improvement.
It is measurable recovery within 90–120 days:
- Reduction in deviation backlog
- Faster batch disposition
- Stabilized execution rhythms
- Recovered capacity without additional headcount or capital
The number you calculated is not theoretical.
It represents recoverable value already trapped in your system.
The question is not whether the opportunity exists.
The question is whether you will structure execution to capture it.
Next Steps
→ Run the COPQ Calculator (if you haven’t already)
→ Schedule a Discovery Call to translate your COPQ into a 90–120 day recovery plan
→ Explore how BatchTrak™ reinforces governance at the point of execution

Step by step instructions on how to use GMPKit's free Cost of Poor Quality calculator. This video is for quality leaders at the manager, director and executive level that need a framework for quantifying internal cost of poor quality.
Tags
Related Posts

Don’t Start Conversations as a Bulldozer — Start Them as a Domino
Most operational conversations in pharmaceutical manufacturing begin like bulldozers—forceful, reactive, and loud. Effective leaders start them like dominos: small, precise actions that trigger system-wide improvement.

Exposing the Hidden Factory: How COPQ Reveals Capacity Constraints
The Hidden Factory represents unmeasured capacity consumed by internal failure activities such as deviation investigations, production rework, and documentation errors. While these activities are tracked operationally, their economic impact is rarely quantified. Applying the Cost of Quality framework translates this consumption into financial terms, providing a basis for capacity recovery and risk-informed prioritization aligned with ICH Q9 and Q10.